Live Trading Copilot for ES & NQ Futures
Real-time trade alerts, execution map levels, trade desk insights, Market State, Market Internals, and Options Flow — unified into one live decision panel.
Trades tracked and viewable in the performance dashboard for transparency and accountability.
Operated on a TopstepX 2K EOD drawdown account for accountability and transparency.
Three level types. One session map.
Intraday
Key algorithmic levels for the current trading session.
HTF
Higher Time Frame levels that could potentially provide support or resistance in the current session.
Prior
Contextual levels from prior sessions that can impact the direction of the current session.
A real-time desk read of the intraday session.
Real-Time Read
Volume profile and context-based interpretation of price action.
Live Trade Analysis
Real-time breakdown of active trades, with context on entries, adds, and evolving risk.
Trade Logs
A complete log of all entries, scales, and exits.
Is the flow with you — or against you?
Market State confirms your thesis — it doesn't generate one.
Near-term flow supports upside follow-through.
If your idea is long, the environment confirms it.
Near-term flow supports downside follow-through.
If your idea is short, the environment confirms it.
Control is shifting — direction isn't settled.
Wait for clarity or apply stricter criteria.
No clear dominance — conditions are mixed or quiet.
Your setup must stand on its own.
How traders use Market State
Confirm
Trade with greater confidence when flow aligns with your thesis.
Conflict
Reduce size or wait when flow contradicts your direction.
No Conviction
In TRANSITION or NEUTRAL states, avoid forcing trades.
Market State is a confirmation layer — manage entries and exits with your own levels.
Is the move supported?
Price can break out. Without participation, it fails. Market Internals reveals whether the move has real support — in real time.
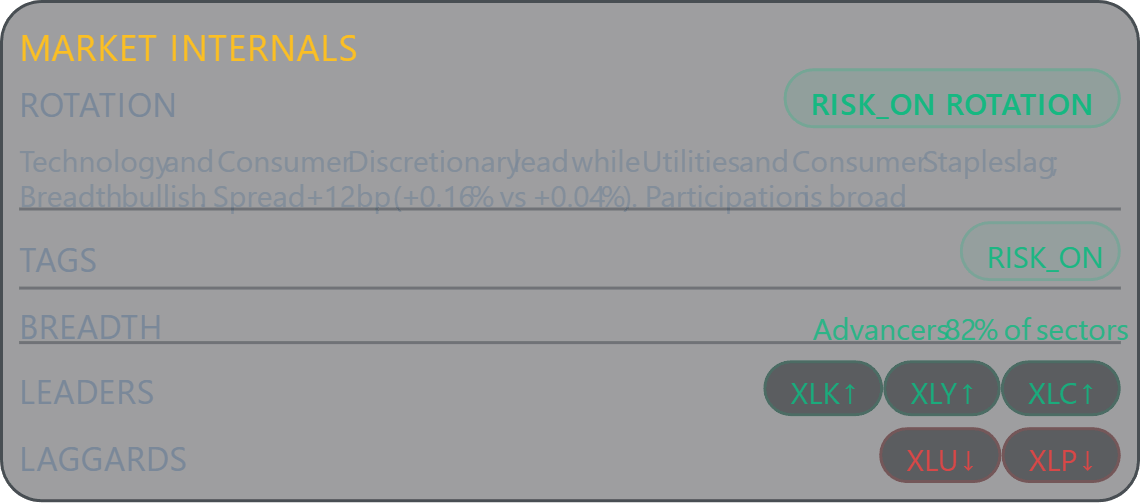
Rotation
RISK-ON / DEFENSIVE / MIXED — shows where capital is flowing.
Breadth
BULLISH / BEARISH / MIXED — measures sector participation and conviction.
Leaders
Sectors pulling the market higher — live ranking by strength.
Laggards
Sectors dragging behind — warns when participation is thinning.
Confirms or challenges what Market State is communicating.
What is the options market telling you?
Live options data — gamma, vanna, and charm — distilled into a clear, actionable posture.
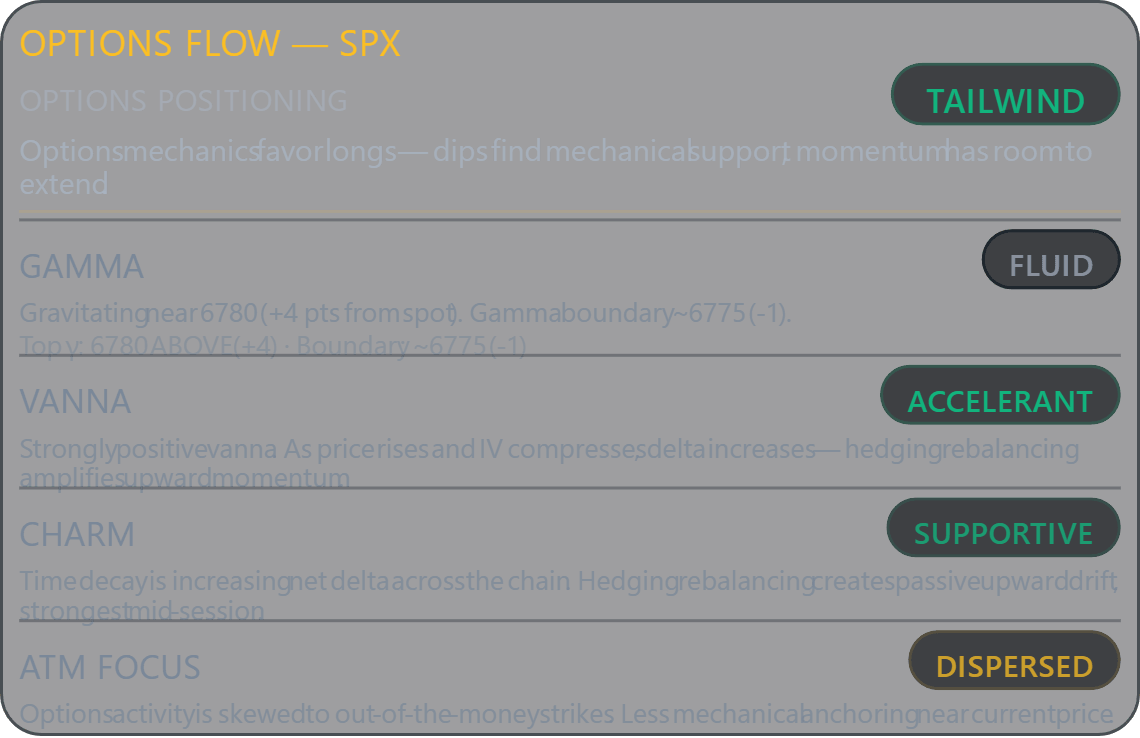
Options Positioning
TAILWIND / HEADWIND / PINNED / OPEN / MIXED — composite read across all options Greeks.
Gamma
PINNED / ANCHORED / FLUID — shows whether hedging is concentrating price or allowing expansion.
Vanna
ACCELERANT / SUPPORTIVE / STABLE / HEADWIND — indicates whether IV dynamics are aiding or resisting price direction.
Charm
SUPPORTIVE / SUPPRESSIVE / MUTED — shows whether time decay is driving dealers to buy back hedges or unload.
ATM Focus
CONTESTED / BALANCED / DISPERSED — reveals whether positioning is concentrated at current levels or skewed to OTM strikes.

Day Passes. Structured Access.
Choose your session. Trade within a defined framework window.
09:30–10:30 ET (60 min)+30 min free — launch complimentary
- Live Trades
- Execution Map
- Trade Desk Insights
- Market State
- Market Internals
- Options Flow— launch complimentary
09:30–12:00 ET (150 min)+30 min free — launch complimentary
- Live Trades
- Execution Map
- Trade Desk Insights
- Market State
- Market Internals
- Options Flow
09:30–16:15 ET (Full session)
- Live Trades
- Execution Map
- Trade Desk Insights
- Market State
- Market Internals
- Options Flow
Pass Block Utilization (PBU): Your first block of 20 passes is included with your first purchase. Additional blocks are $99 per 20 passes.
Frequently Asked Questions
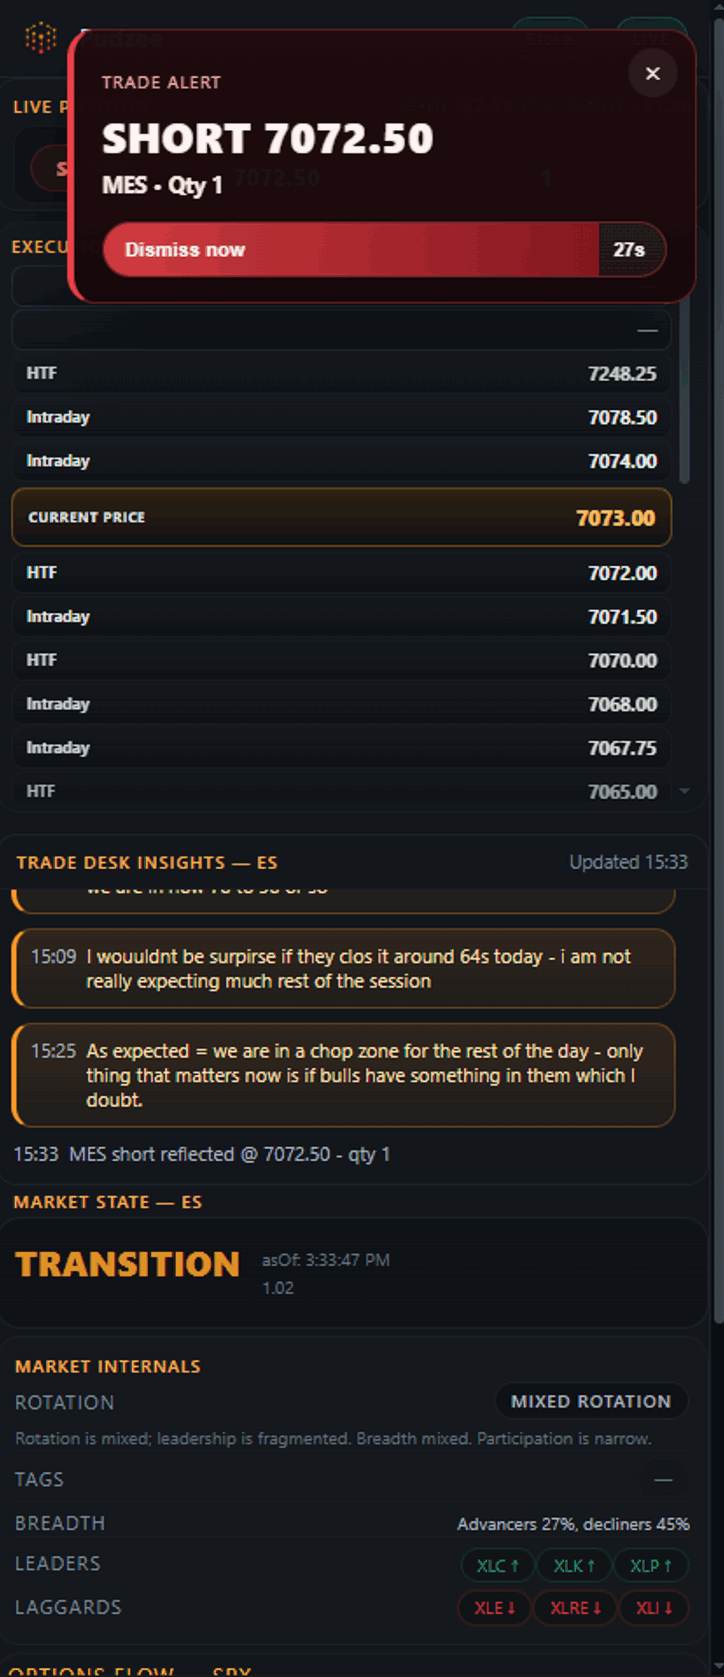
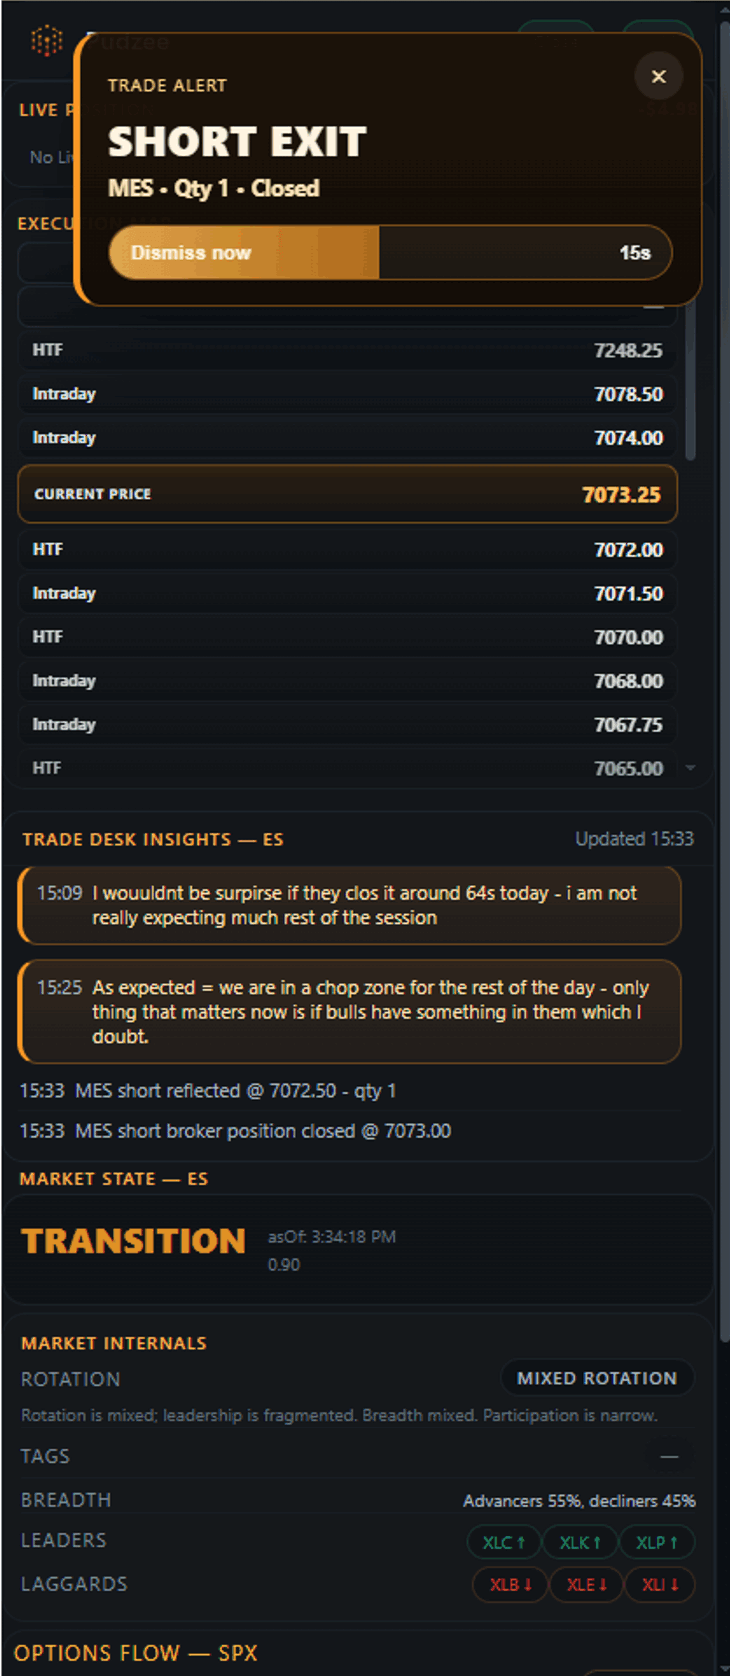
Does Pudzee publish live trade alerts in real time?
Yes. Pudzee shows live entries, scales, and exits as they develop during the session. The goal is to provide real-time trade context and transparency, not hindsight recaps after the move is already over.
Should I blindly follow the live trades?
No. The live trades are there for context, execution insight, and accountability. You should still size appropriately, manage your own risk, and decide whether a trade fits your own plan.
What is the Performance Dashboard?
The Performance Dashboard is the accountability layer of the service. It displays combined live results from the TopstepX 2K EOD drawdown account, including net P&L, win rate, profit factor, trade count, durations, and session history.
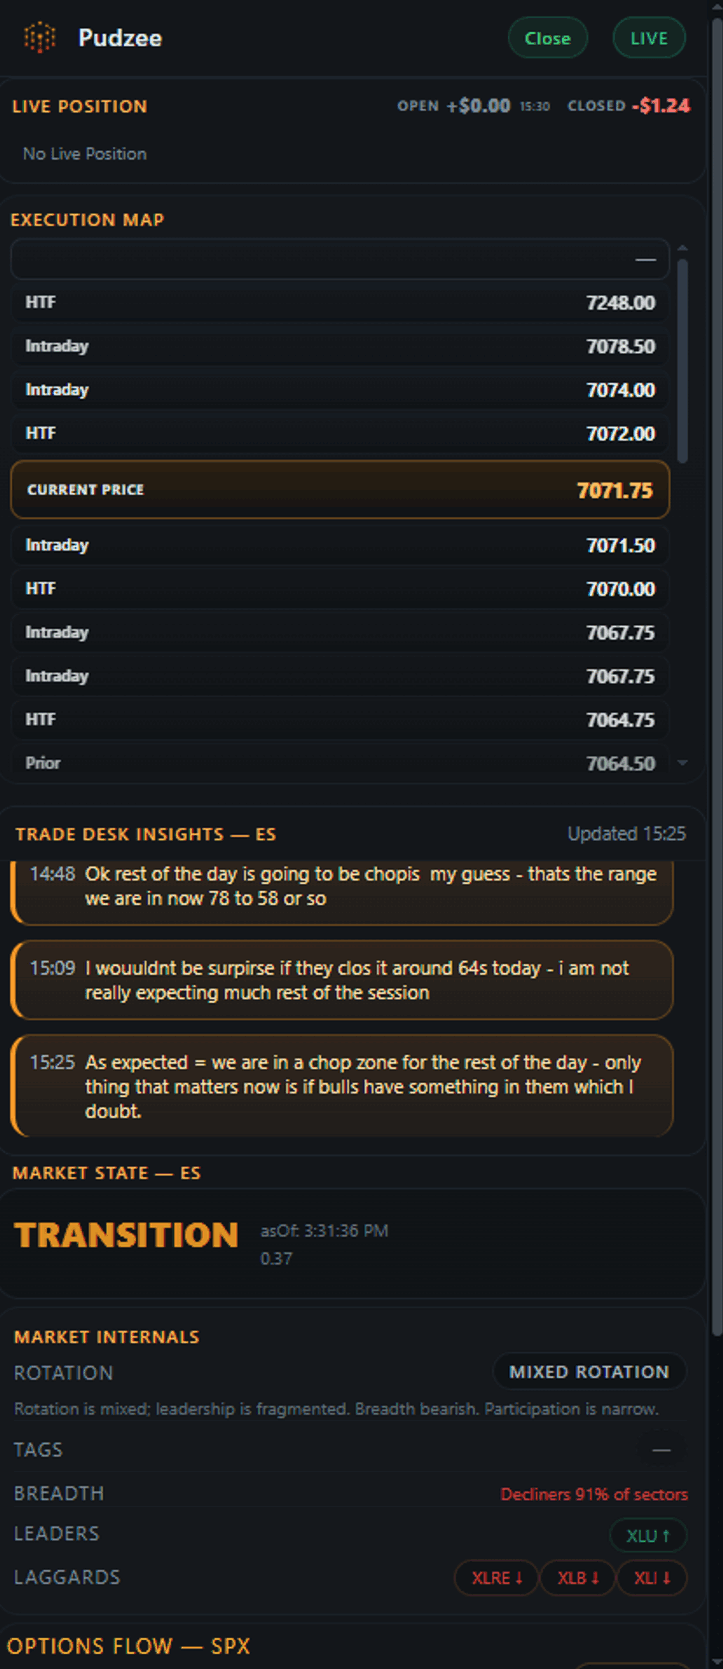
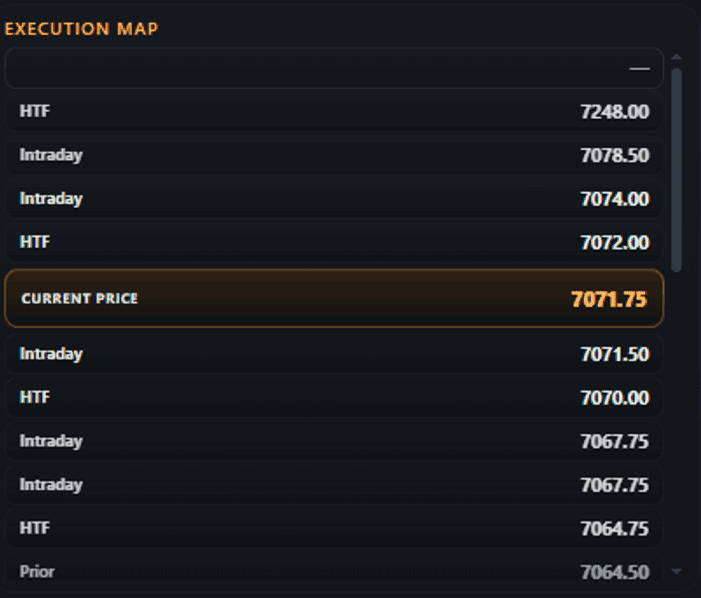
What is the Execution Map?
The Execution Map organizes the levels that matter most for the current session: Intraday, higher time frame, and prior-session levels. It helps frame likely support, resistance, reaction, and breakout areas before price gets there.
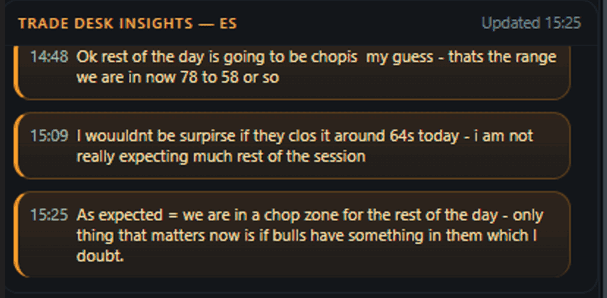
What are Trade Desk Insights?
Trade Desk Insights combine a real-time read of price action with live trade analysis and a running trade log. The goal is to show what the desk is seeing, how active trades are being evaluated, and how entries, scales, and exits are unfolding through the session.
Why trade Micros instead of E-minis?
We trade Micros on purpose. The goal is not to show the biggest dollar P&L possible, but to demonstrate consistency on a small, disciplined account that can be replicated at whatever size a trader chooses. Most traders burn through prop accounts chasing size before they've learned consistency. We believe the real skill is keeping one account alive, trading it well, growing it with discipline, and then replicating that process across multiple accounts. Depending on the prop firm, traders can operate 5 to 20 accounts per firm simultaneously.
What do the Market State labels mean?
Bullish and Bearish indicate directional conditions with supportive flow. Transition means the auction is shifting and directional control is changing. Neutral means there is no clear dominance and the session requires more selectivity.
What do Market Internals show?
Market Internals track participation beneath the surface of price, including breadth, rotation, and leadership quality. They help show whether a move is broadly supported or becoming narrow and vulnerable.